



Main Window
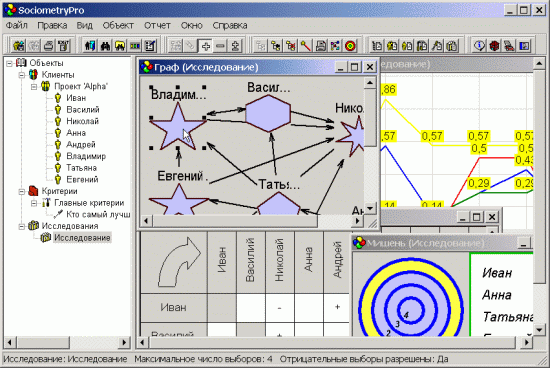
The main window provides a set of tools and displays organized sociometric objects in the left-hand panel. The right-hand side is used to open detailed views of different aspects of a completed study. In practice, you simply select an object on the left and open one of the available views on the right. You can keep several views open at the same time, which is especially useful when comparing different objects or studies.
Objects
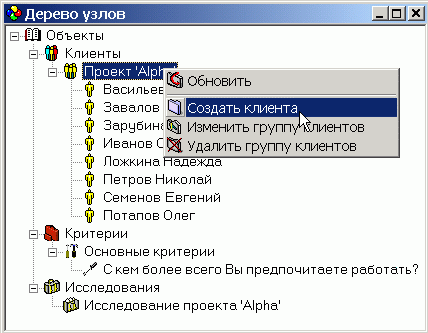
The object tree helps organize your data in the left-hand part of the main window. Its clear hierarchical structure makes it easy to navigate through projects and quickly find the required element. Once an object is selected, you can open one of the available views in the right-hand part of SociometryPro. This keeps the data you need close at hand without having to search for it for a long time.
Choices
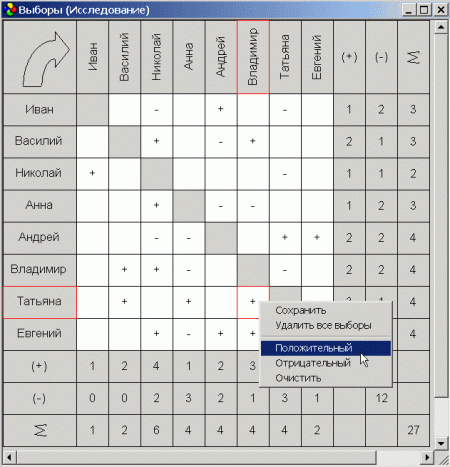
Once a study has been created, you can open its Choices window. The table allows you to visually record the choices made by members of the group being studied. A simple mouse click is enough to mark a positive or negative choice or clear the contents of a cell.
Indices
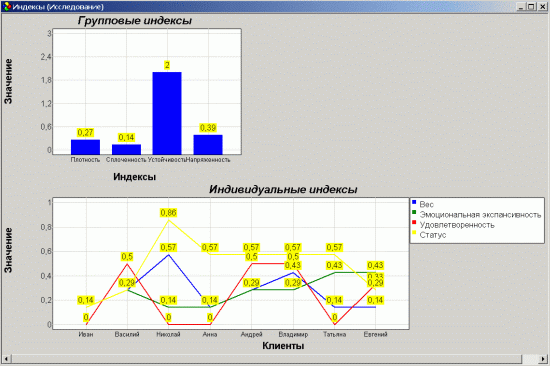
This window displays all group and individual indicators of the study as charts. Sociometric indices are calculated values obtained from the results of the study. They help reveal important characteristics of the group and provide information that can support further professional analysis and decision-making.
Even for a relatively small group, manual calculations can be time-consuming. This is where SociometryPro is especially useful: not in conducting the survey itself, but in processing its results. The program allows specialists to spend less time on calculations and focus more on working with people. Many results can also be obtained immediately during data entry, without a long delay before the required indicators become available.
Graph

This window displays all choices made by participants as a graph. You can change the types of shapes and arrange them manually in the most convenient way. This form of visualization can reveal details that are difficult to notice when looking only at numerical values calculated from the study. It can also be useful when discussing the results with colleagues or clients.
Target

When you move the mouse pointer over a ring, SociometryPro displays a list of participants who received the same number of incoming choices as the value shown on that ring. In other words, the list contains the names of participants who were chosen N times, where N is the value of the selected ring. This provides another visual way to present and analyze the results of a sociometric study.