



Introduction
This tutorial is intended for users who are launching SociometryPro for the first time and do not want to spend much time studying the User Guide and other documents supplied with the product.
The main goal of working with SociometryPro is to create a sociometric study containing the required data and evaluate its results using clear visualization tools and available reports.
Below we will briefly review the basic principles of working with the program by following a typical sequence of steps in a simple example. We will go through:
- Preparation, the main purpose of which is to prepare for the sociometric survey
- Sociometric survey, which is the sociometric testing itself
- Analysis of the sociometric survey results, the final stage devoted to calculating the indicators obtained from the sociometric testing
Preparation
Before sociometric testing can be carried out, a set of supporting data must be prepared. This preliminary stage includes:
- A project in which all sociometric data you create is stored
- A group of participants taking part in the sociometric survey
- A study criterion (or sociometric question asked of each participant in the group)
- A sociometric study to which the participants' choices and the obtained results are linked
Starting SociometryPro and creating a project
The program allows you to create different projects and thus separate the data you use according to a chosen principle (for example, a project for School No. 20, for IBM, etc.). To create a new project:
- Start SociometryPro from the “SociometryPro by LeDiS Group” program group (via the Windows “Start” menu).
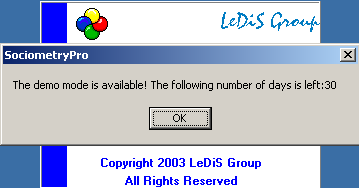
- If the program is running in demo mode (not registered), click OK in the following message:
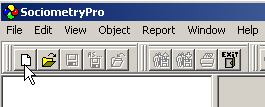
- In the “SociometryPro” window that opens, create a new project using the “Create new project” toolbar button.
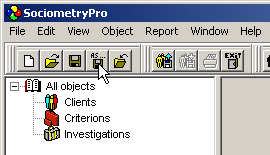
- Save the project using the “Save current project as…” toolbar button. Specify the project file name when prompted.
Creating a participant group
A sociometric test always involves a group of participants. Therefore, this group must first be created in the program. The participants belonging to the group are then added. During the sociometric test, the participants will indicate their choices according to the defined criterion (question).
To create a participant group, follow these steps:
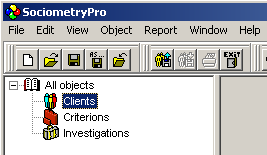
- Select the "Clients" node in the object tree and press INSERT on the keyboard.
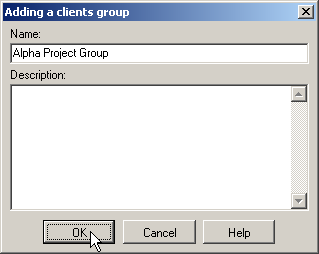
- In the "Add Client Group" window that opens, enter the group name "Project 'Alpha' Group" and click Yes.
- To add a participant to the created group, select the “Project 'Alpha' Group” node in the object tree and press INSERT.

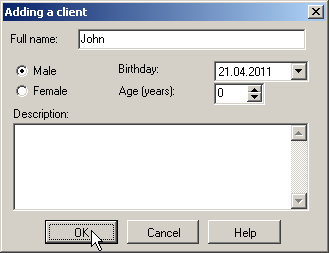
- In the "Add Client" window that opens, enter the participant's full name "Ivanov Petr Alekseevich" and click Yes. If required, specify the participant's gender, date of birth, and age.
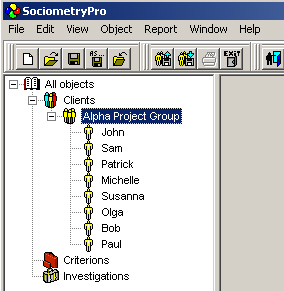
- In the same way (see the previous step), create 7 more participants with the following full names:
- Semenov Vladimir Petrovich
- Samoylova Tatyana Sergeevna
- Shakhov Andrey Evgenievich
- Sidorova Natalya Andreevna
- Pakhomova Elena Aleksandrovna
- Efimov Semen Zakharovich
- Nikolaev Oleg Semenovich
- Save the project with the created participant group using the “Save” toolbar button.
PS:
Please remember that a participant group must contain at least 2 people in order to create a sociometric study.
Defining a criterion
In SociometryPro, every criterion belongs to a criterion group. Criterion groups make it possible to organize criteria according to categories defined by the consultant. For example, you can create a group called "Formal Criteria" or "Informal Criteria", a group called "Criteria for Project Alpha", and so on.
To define a criterion, follow these steps:
- To create a criterion group, select the "Criteria" object in the tree and press INSERT.

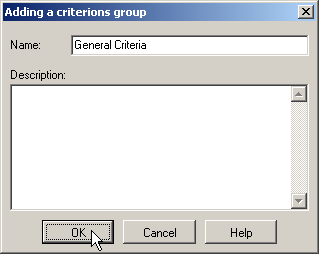
- In the "Add Criterion Group" window that opens, enter the group name "Main Criterion Group" and click Yes.
- To add a criterion to the created group, select the “Main Criterion Group” node in the object tree and press INSERT.
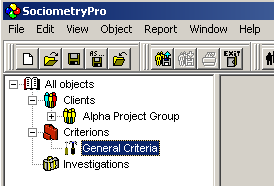
- In the "Add Criterion" window that opens, enter the criterion wording "Who would you prefer to work with on Project 'Alpha'?" and click Yes.

- Save the project data using the main menu item “File -> Save”.
Creating a sociometric study
A SociometryPro sociometric study links the sociometric testing data and defines its additional settings. A study uniquely associates a specific participant group with a specific criterion.
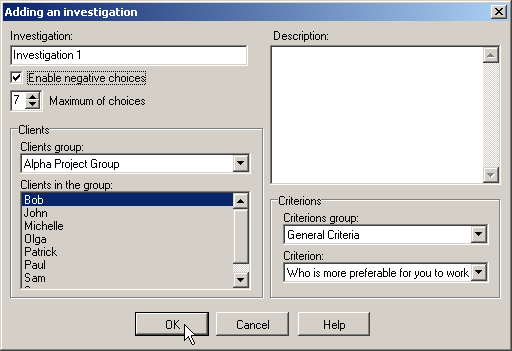
Within a study, participants can either be allowed or prohibited from making negative choices when responding to the criterion. Positive choices are always available.
In addition, each study requires you to define the maximum number of choices of any type (positive or negative) that any participant may make with respect to the other participants.
To create a sociometric study:
- Select the "Studies" node in the object tree and press INSERT.
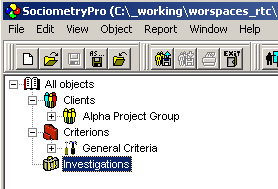
- In the "Add Study" window that opens, keep the default name "Study 1", enable the "Negative choices allowed" option, and set the "Max. number of choices" to 4. Click Yes to confirm creation of the study.
- Save the project data using the main menu item “File -> Save”.
Conducting the sociometric survey
Sociometric testing of a group is carried out in the usual way using standard paper sociometric forms. These forms can be generated automatically in SociometryPro and printed.
To create sociometric forms:
- Select the sociometric study node in SociometryPro.

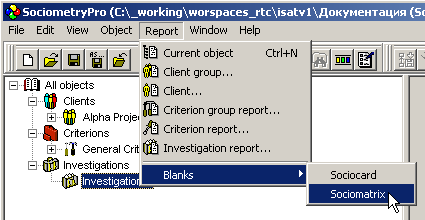
- Create a sociometric card form using the main menu “Report -> Forms -> Sociometric Card”. Specify the name of the report file in which the form will be saved.

- Create a sociomatrix form using the main menu “Report -> Forms -> Sociomatrix”. Specify the name of the report file in which the form will be saved.
PS:
During sociometric testing, give each participant a printed sociometric card form to complete.
The printed sociomatrix form serves as a supporting document for the consultant and can be used for initial processing of the results when a computer with SociometryPro is not available. These data can later be transferred to the program's choices table during the next stage, when analyzing the sociometric survey results.
Analysis of the sociometric survey results
The consultant enters the results of the sociometric testing into the choices table as described below. The visualization tools can then be used and reports can be generated.
Entering choice results into SociometryPro
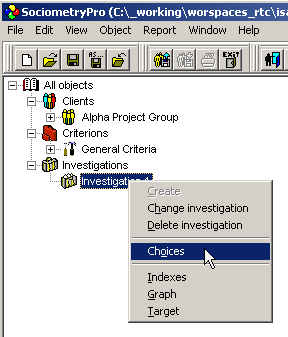
- To open the "Choices" window, select the "Study 1" node in the object tree and use the “Choices” context menu:
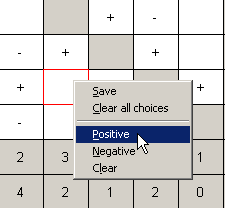
- In the choices child window that opens, specify the participants' choices with the mouse using the "Positive", "Negative", and "Clear" context menu commands, or simply by clicking the left mouse button while moving the pointer over the table cells.
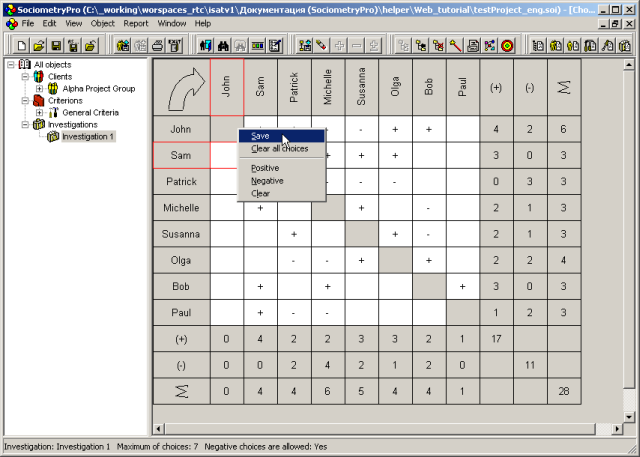
- Use the "Save" context menu command to save the changes made in the choices table.
PS:
The large arrow in the left corner of the choices window indicates who chooses whom. In the previous figure, the participants listed in the left-hand column choose the participants shown across the top row. The corresponding choice is located at the intersection of the row and column.
Do not forget to complete step 3, because without saving the choices, the subsequent graphical result interpretation views will be empty.
Graphical interpretation of results
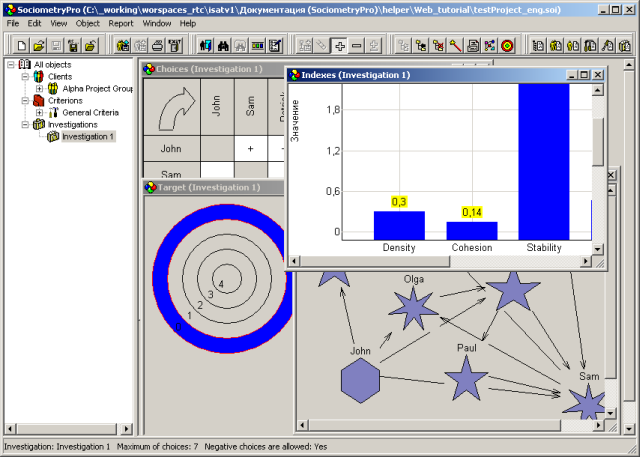
SociometryPro's graphical interpretation tools provide a clear visual representation of the state of the group. This assessment is performed using the following visualization forms:
The program provides three types of visualization windows:
- Indices, which display quantitative group characteristics as charts of group and individual sociometric indices.
- Graph, which represents the group of participants involved in a study as a graph. Each component shown as a shape corresponds to one participant in the group, while choices between them are shown as arrows.
- Target, in which each ring corresponds to a list of participants who received a certain number of choices. The closer a ring is to the center, the greater the number of choices received by each participant in that list.
To create graphical interpretations of the sociometric study results:
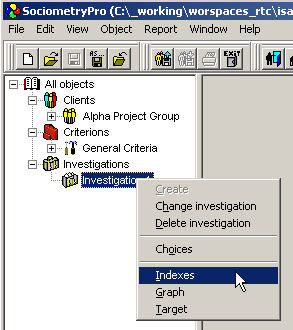
- Select the "Study 1" node in the object tree. To display the indices view, use the “Indices” context menu:
- Similarly, to open the graph view, select the "Study 1" node in the object tree and use the “Graph” context menu.
- Similarly, to open the target view, select the "Study 1" node in the object tree and use the “Target” context menu.
- Carefully analyze the obtained results using your professional experience.
- Save the project data using the main menu item “File -> Save”.
PS:
When analyzing results in the graphical interpretation views, you can assess positive and negative choices using the "Positive choices" and "Negative choices" context menu commands. The graph also provides an additional "All choices" context menu command, which displays both positive and negative choices in a single window.
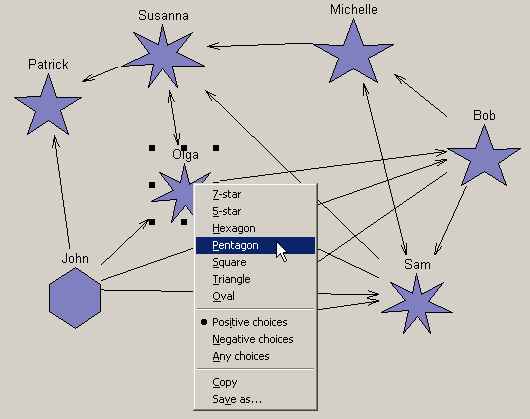
When analyzing the graph, you can also modify any shapes manually using the context menu for those shapes. This manual adjustment can make the graphical presentation of sociometric study results clearer.
Generating reports
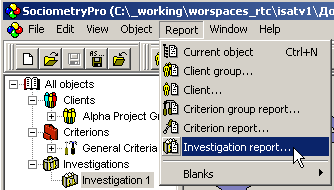
Reports allow you to create HTML documentation based on the results of a sociometric study and print it if required. To create a report for a sociometric study:
- Use the main menu item “Report -> Study…”.
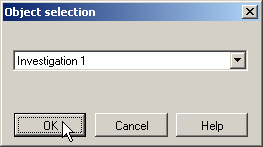
- In the “Select Object” window, select “Study 1” in the list and click Yes.
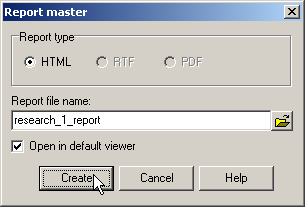
- Specify the report file name, enable “Open in default program”, and click Create.
- Print the generated HTML document.