



Analysis of the sociometric survey results
The consultant enters the results of the sociometric testing into the choices table as described below. The visualization tools can then be used and reports can be generated.
Entering choice results into SociometryPro
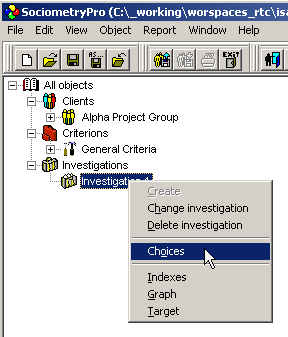
- To open the "Choices" window, select the "Study 1" node in the object tree and use the “Choices” context menu:
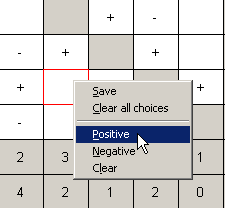
- In the choices child window that opens, specify the participants' choices with the mouse using the "Positive", "Negative", and "Clear" context menu commands, or simply by clicking the left mouse button while moving the pointer over the table cells.
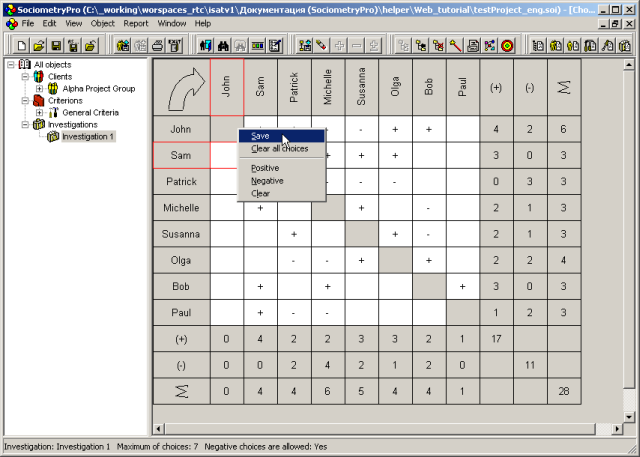
- Use the "Save" context menu command to save the changes made in the choices table.
PS:
The large arrow in the left corner of the choices window indicates who chooses whom. In the previous figure, the participants listed in the left-hand column choose the participants shown across the top row. The corresponding choice is located at the intersection of the row and column.
Do not forget to complete step 3, because without saving the choices, the subsequent graphical result interpretation views will be empty.
Graphical interpretation of results
SociometryPro's graphical interpretation tools provide a clear visual representation of the state of the group. This assessment is performed using the following visualization forms:
The program provides three types of visualization windows:
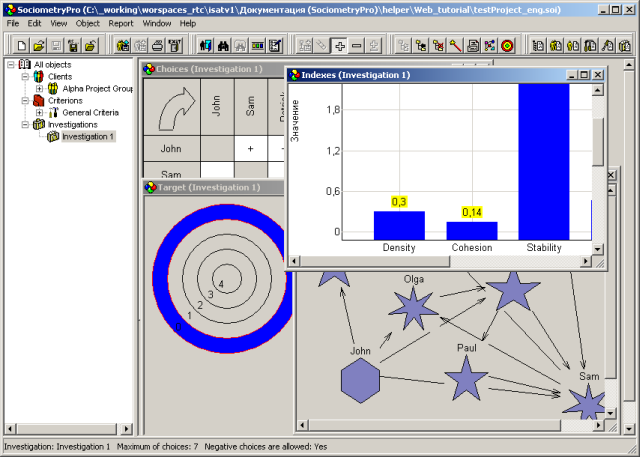
- Indices, which display quantitative group characteristics as charts of group and individual sociometric indices.
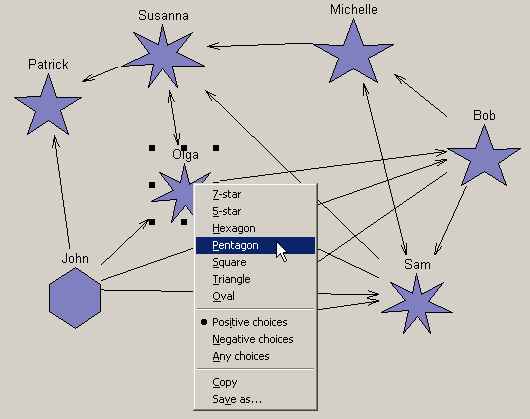
- Graph, which represents the group of participants involved in a study as a graph. Each component shown as a shape corresponds to one participant in the group, while choices between them are shown as arrows.
- Target, in which each ring corresponds to a list of participants who received a certain number of choices. The closer a ring is to the center, the greater the number of choices received by each participant in that list.
To create graphical interpretations of the sociometric study results:
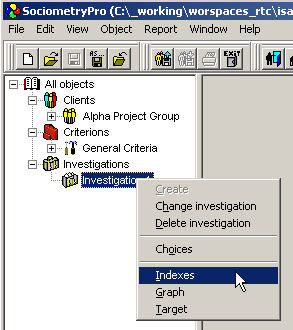
- Select the "Study 1" node in the object tree. To display the indices view, use the “Indices” context menu:
- Similarly, to open the graph view, select the "Study 1" node in the object tree and use the “Graph” context menu.
- Similarly, to open the target view, select the "Study 1" node in the object tree and use the “Target” context menu.
- Carefully analyze the obtained results using your professional experience.
- Save the project data using the main menu item “File -> Save”.
PS:
When analyzing results in the graphical interpretation views, you can assess positive and negative choices using the "Positive choices" and "Negative choices" context menu commands. The graph also provides an additional "All choices" context menu command, which displays both positive and negative choices in a single window.
When analyzing the graph, you can also modify any shapes manually using the context menu for those shapes. This manual adjustment can make the graphical presentation of sociometric study results clearer.
Generating reports
Reports allow you to create HTML documentation based on the results of a sociometric study and print it if required. To create a report for a sociometric study:
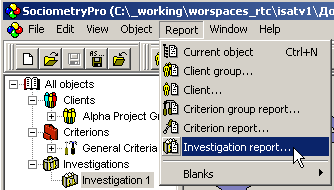
- Use the main menu item “Report -> Study…”.
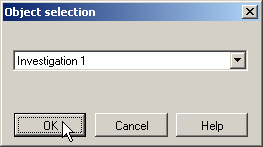
- In the “Select Object” window, select “Study 1” in the list and click Yes.
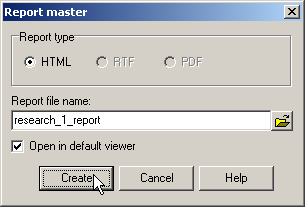
- Specify the report file name, enable “Open in default program”, and click Create.
- Print the generated HTML document.