Sociometry Research Analysis
Sociometry testing results are entered into SociometryPro choices table by a mentor as it’s described below. In resulting of that, you can open different visualization forms and build reports.
Entering choices into SociometryPro
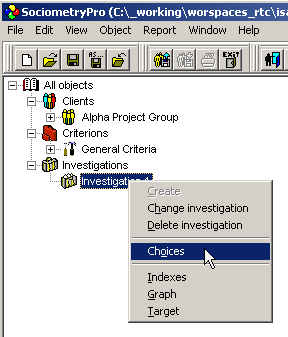
- To open windows “Choices”, select “Investigation 1” node and use context menu “Choices”:
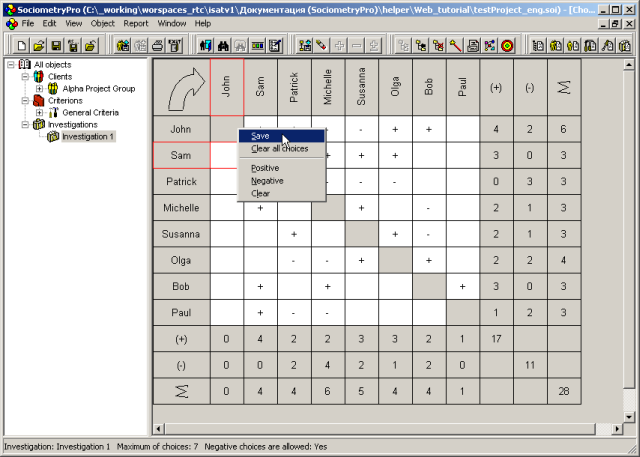
- In opened choices table window, use mouse to input choices in the cells (use context menus "Positive", "Negative", "Clear" or press mouse left button over the table cells).
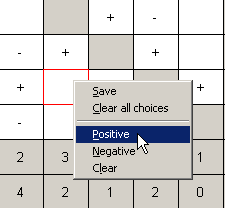
- Use context menu “Save” to save the entered choices.
PS:
Large arrow in upper left corner of the choices window defines who really makes choices. In this case (see the previous picture), the clients in left column choose those clients who is placed at the top row. And a choice is placed in the crossing a row and a column.
Don’t forget pass step 3 or you will not see the sociometry data in visualization forms and reports.
Visualization of results
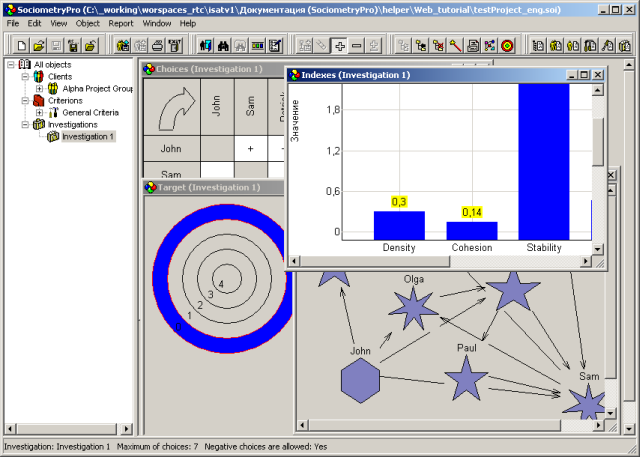
SociometryPro can present the sociometry results using suitable visualization forms. It’s provided with three types of visualization forms:
- Indexes, where you can see the number characteristics of a sociometry testing as charts of group and private sociometry indexes
- Graph, where a client group is presented as a suite of different figures on the plane. Here, each figure is related to a client in the client group, and all choices are shown as arrows amongst those figures
- Target, where each ring of the form is related to a client list with equal input choices. Here, the more nearly a ring to the center of the form, the higher number of choices was got by clients of this ring
To build visualization forms, perform next:
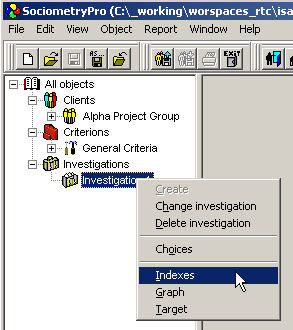
- Select "Investigation 1" node in the tree view. To open forms with indexes press context menu “Indexes”:
- In the same way as at previous step, to open form with graph, select "Investigation 1" node in the tree view and press context menu “Graph”.
- In the same way as at previous step, to open form with target, select "Investigation 1" node in the tree view and press context menu “Target”.
- Carefully look for the sociometry results presented in visualization forms using all your experience and knowledge in sociometry area.
- Save project data with main menu item “File -> Save”.
PS:
Visualization forms help in evaluation of both positive and negative choices. Here, you can use context menu items in visualization forms such as “Positive choices” and “Negative choices”. As well, you can use “Any choices” to show all choices in a visualization form.
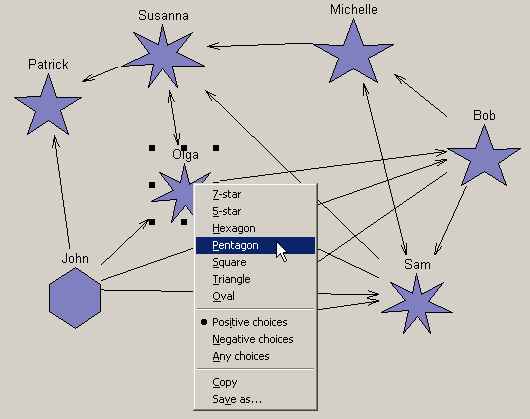
As well, you can change figures in the graph form on your own. Such a manual change of figures helps to make graph view more suitable for analysis.
Building reports
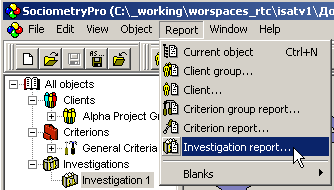
Reports can be created in HTML format and printed at a printing device. To build a sociometry report, perform next:
- Use main menu item “Report -> Investigation report…”.
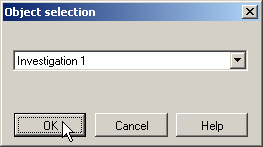
- In the window “Object selection”, press нажмитеOKwith “Investigation 1” selected.
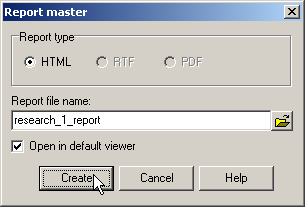
- Input report file name in “Report master” window, check “Open in default viewer” and press Create.
- Print the opened report with a printing device.